
Reach report, January to June 2026
Six months of posting, impressions and reach across Facebook, Instagram, LinkedIn, YouTube and Google Business Profile.
Overview.
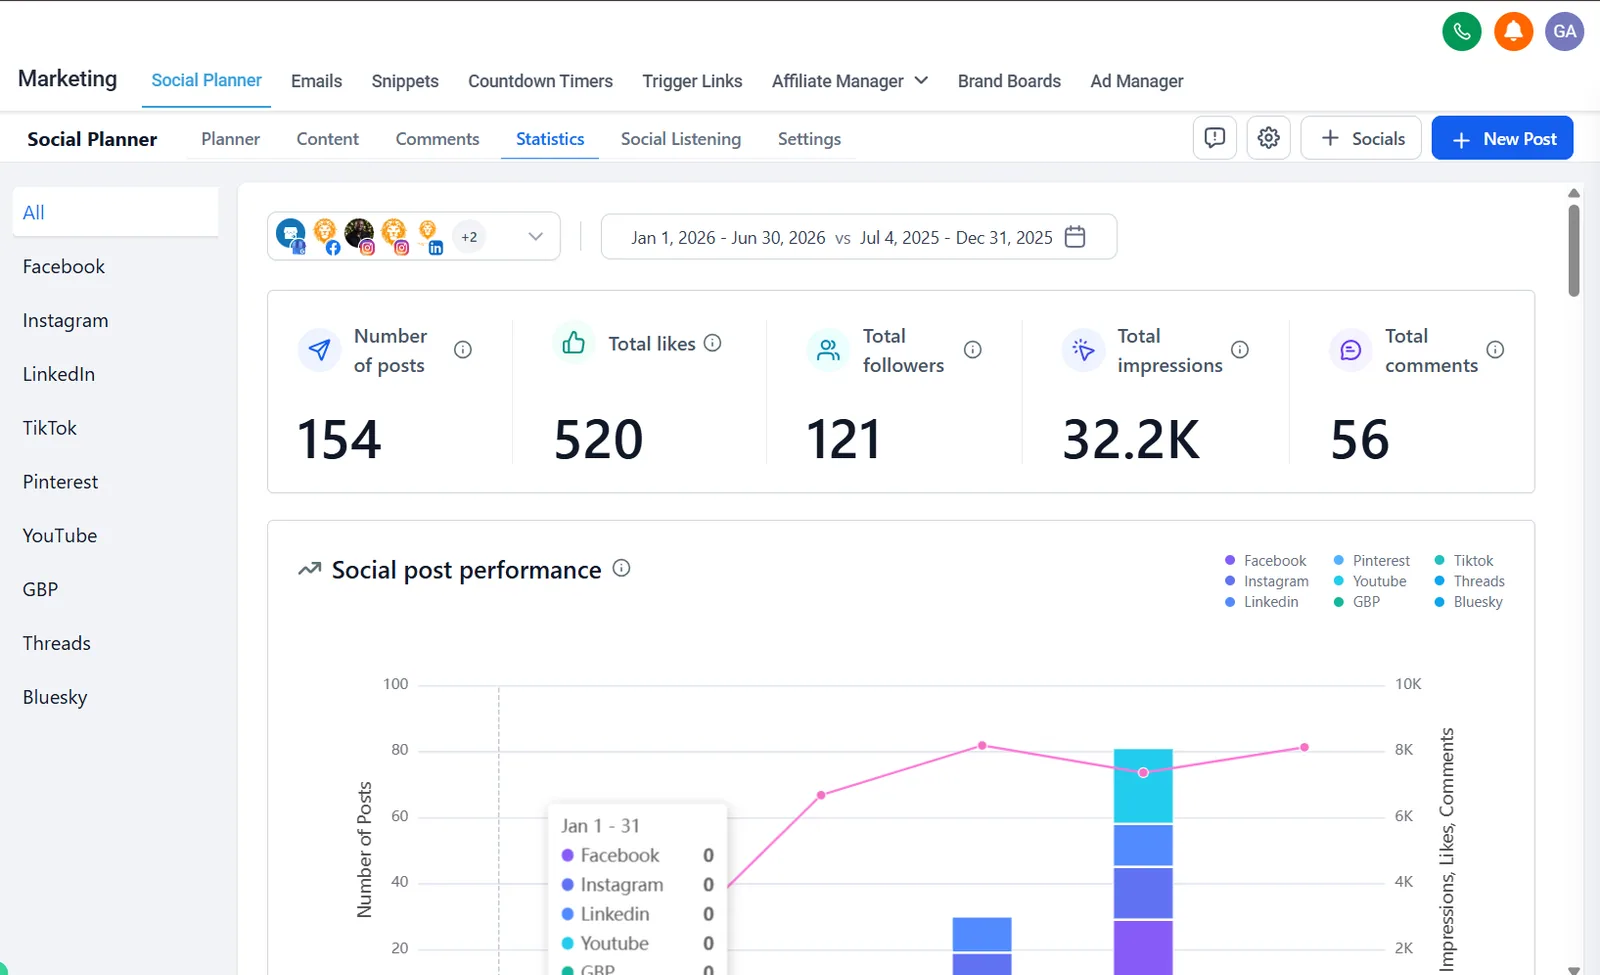
This is the statistics view of the social planner used to manage a set of accounts, covering January 1 to June 30, 2026.
It shows what was posted, where it was posted and what it reached, in the platform's own numbers.
What was made.
- Six month statistics view
- Posts, impressions and reach by platform
- Monthly trend charts
The work.
What the numbers show.
- 154 posts were published: 49 on LinkedIn, 42 on Instagram, 39 on Facebook and 24 on YouTube.
- Impressions totalled 32.2K. Instagram produced 29.65K of them, Facebook 1.49K and LinkedIn 1.04K.
- Post reach came to 16.53K, of which Instagram accounted for 13.84K, Facebook 1.4K, LinkedIn 679 and YouTube 610.
- Posting began in February and peaked in May. Monthly impressions rose from near zero in January to roughly 6K to 8K a month from March to June.
How it is reported.
Each metric is broken down by platform so a client can see where the effort pays off. The same view carries total likes, followers and comments, and a monthly line chart for trend.
Formats.
Results.
- 154
- 32.2K
- 16.53K
- 29.65K
- 520
- 56
Republic Auto maintenance carousel
Send us the footage.
Or the brief, the idea, or the account that needs a hand.